The seven days
A day's range here is its highest price minus its lowest, divided by its opening price, from Hyperliquid's BTC perpetual in hourly candles. It measures how far price travelled inside the day, not where it ended.
| Day (UTC) | Open | High | Low | Close | Range |
|---|---|---|---|---|---|
| 25 Oct | $80,862 | $81,014 | $79,817 | $80,108 | 1.5% |
| 26 Oct | $80,109 | $80,835 | $79,347 | $80,110 | 1.9% |
| 27 Oct | $80,111 | $81,281 | $79,489 | $80,889 | 2.2% |
| 28 Oct | $80,889 | $81,804 | $80,362 | $81,319 | 1.8% |
| 29 Oct | $81,319 | $81,955 | $77,856 | $77,947 | 5.0% |
| 30 Oct | $77,948 | $78,772 | $76,264 | $77,338 | 3.2% |
| 31 Oct | $77,338 | $77,750 | $77,072 | $77,535 | 0.9% |
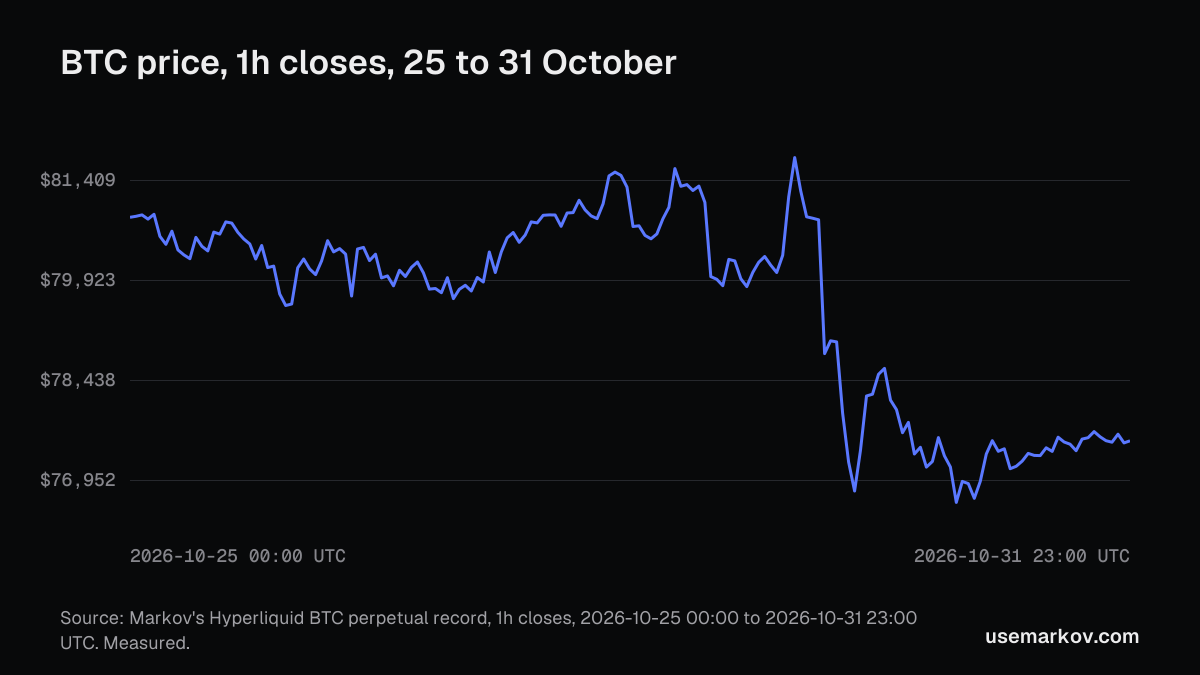
What the week shows
- Five of the seven days stayed within 2.3%. The seven-day mean was 2.4%, pulled up by two wide days.
- The wide days sit next to each other: 29 October (5.0%) and 30 October (3.2%) are where the chart steps down from about $81,000 to about $77,000.
- Across the whole week, the highest price was $81,955 and the lowest $76,264, a spread of 7.0% of the week's opening price.
- The quietest day, 31 October, came straight after the widest two.
How to read this
Seven days is a small sample, and one week says little about the next. What it does show is that a "normal" day for BTC is not one number: the week held days under 1% and a day over 5%. The glossary explains the funding rate and open interest, which are the two numbers traders watch for crowded positioning around days like 29 October, and the BTC market page reads them live.
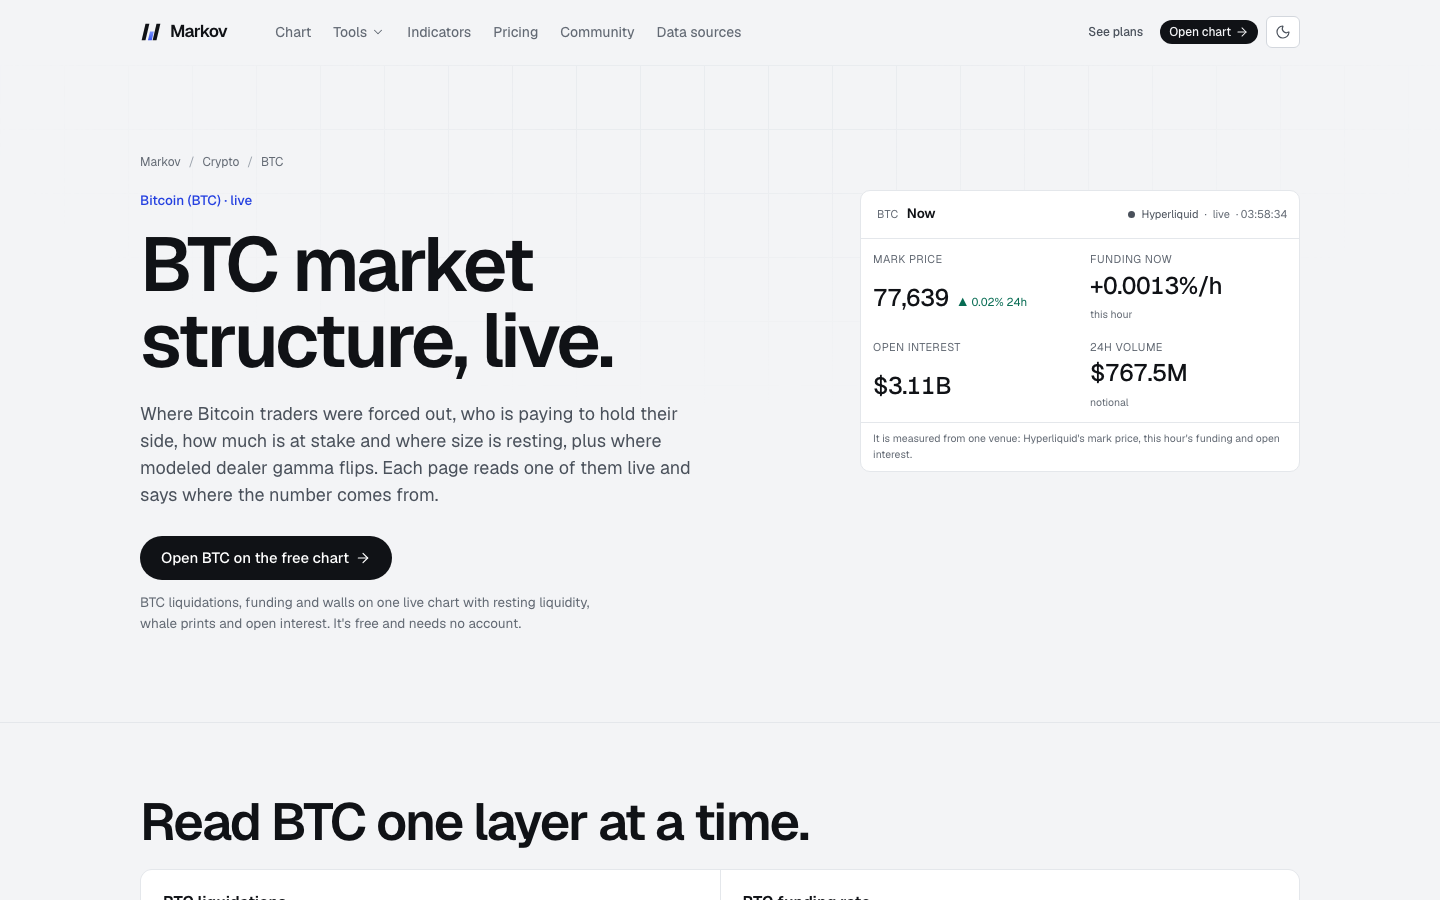
The range is measured from Markov's recorded one-hour candles, which are Hyperliquid's own. Each day is a UTC day. Nothing here is modeled.
Markov provides research tools and education, not financial advice. Past data says what happened, not what will.