What the bright bands are
An order book heatmap draws the resting orders of a market over time. Price runs up the side, time runs across, and a cell is brighter where more size was resting at that price. A bright band that stays at one price is often called a wall. Markov draws Hyperliquid's BTC book as the heatmap behind price on the chart, and that view is on the free plan.
A band is not a trade. It is size that was resting at that moment. So a band shows what was resting, not what happened at it. This post asks one thing about BTC's bands: for how many hours a level kept a place among the three largest on its side.
What the record can and cannot see
Two limits come first, because they shape every number below.
First, the record sees a band around the price, not the whole book. Each minute it holds only the 20 levels nearest the price on each side. For BTC the levels are $100 apart, so that is about $2,000 either way. Across the record the deepest stored level sat a median of 2.41% below and 2.38% above the hour's typical price, and at most 3.08% below and 3.42% above. Levels beyond about 3% are not in the record at all. A level that is out of view counts as zero for that minute, so its hourly size falls as the price moves away from it, even if the order is still there.
Second, the hour is the average of those minutes, cut to the 20 largest hourly averages per side and measured against the hour's typical price, (high + low + close) / 3. A level the price passed through during the hour, a bid above the typical price or an ask below it, is left out.
In this post a run is a stretch of consecutive hours in which the same price is one of the three largest levels the record holds near the price on that side. A run measures how long a level kept that rank. It does not measure how long the order rested. When a run ends, the record cannot say the order left.
How long the runs lasted
Window: 29 October 2026 00:00 UTC to 5 November 2026 00:00 UTC, end exclusive. That is 168 hours, all with a book, none missing. 36 hours were partly recorded, the lowest at 95%. The level step was $100 in every hour.
| Side | Runs | Median | Average | Exactly 1 hour | At least 3 hours | At least 6 hours | At least 12 hours |
|---|---|---|---|---|---|---|---|
| Bid | 295 | 1 hour | 1.71 hours | 176 | 65 | 1 | 0 |
| Ask | 308 | 1 hour | 1.64 hours | 192 | 59 | 2 | 0 |
How the numbers are made: each run is counted from the hourly rows. The average is the total of the run lengths divided by the number of runs. A run cut by the edge of the window is counted inside it. The same price can start more than one run. Over the week, 60 different bid prices and 55 different ask prices were in the top three at some hour.
A median of 1 hour does not mean the orders were gone within the hour. It means most runs lasted a single hour.
Why runs ended
| Side | In view, out-ranked | Price passed through it | Not in the stored 20 | Still running at the end |
|---|---|---|---|---|
| Bid | 231 | 33 | 28 | 3 |
| Ask | 242 | 45 | 18 | 3 |
"In view, out-ranked" means the level was still among the levels the record stores for that hour, only out-ranked. Of 295 bid runs, 231 ended that way, and of 308 ask runs, 242 did. Together that is 473 of 603 runs, 78%. The "not in the stored 20" column covers an order that was pulled, an order that was filled and a level that fell out of view as the price moved, and the record cannot tell those apart. So these run lengths are lower bounds on how long a level rested, not measures of it.
One more limit on the counts. In 173 cases, across 103 hours, a top-three price left and a price one $100 step away joined. These may be one wall recentered on the grid, not a new one, and the counts above treat them as separate runs. That can make runs look shorter than the orders behind them.
The longest runs
| Side | Price | First hour (UTC) | Last hour (UTC) | Hours | Average size | Largest hour | Average distance from typical price |
|---|---|---|---|---|---|---|---|
| Bid | $77,300 | 1 Nov 05:00 | 1 Nov 14:00 | 10 | $23,591,960 | $33,718,260 | 0.86% |
| Ask | $78,400 | 1 Nov 12:00 | 1 Nov 17:00 | 6 | $22,794,800 | $26,350,240 | 0.52% |
| Ask | $79,300 | 2 Nov 06:00 | 2 Nov 11:00 | 6 | $24,404,575 | $28,524,210 | 1.57% |
Several other runs lasted 5 hours. Sizes are in USD, level price times average size in coin. Over the longer record from 14 October 20:00 UTC (507 of 508 hours; 25 October 23:00 UTC has no record and breaks a run), the longest bid run is the same 10 hours, and the longest ask run is 9 hours at $82,100, from 28 October 03:00 to 11:00 UTC. All of these ended in view.
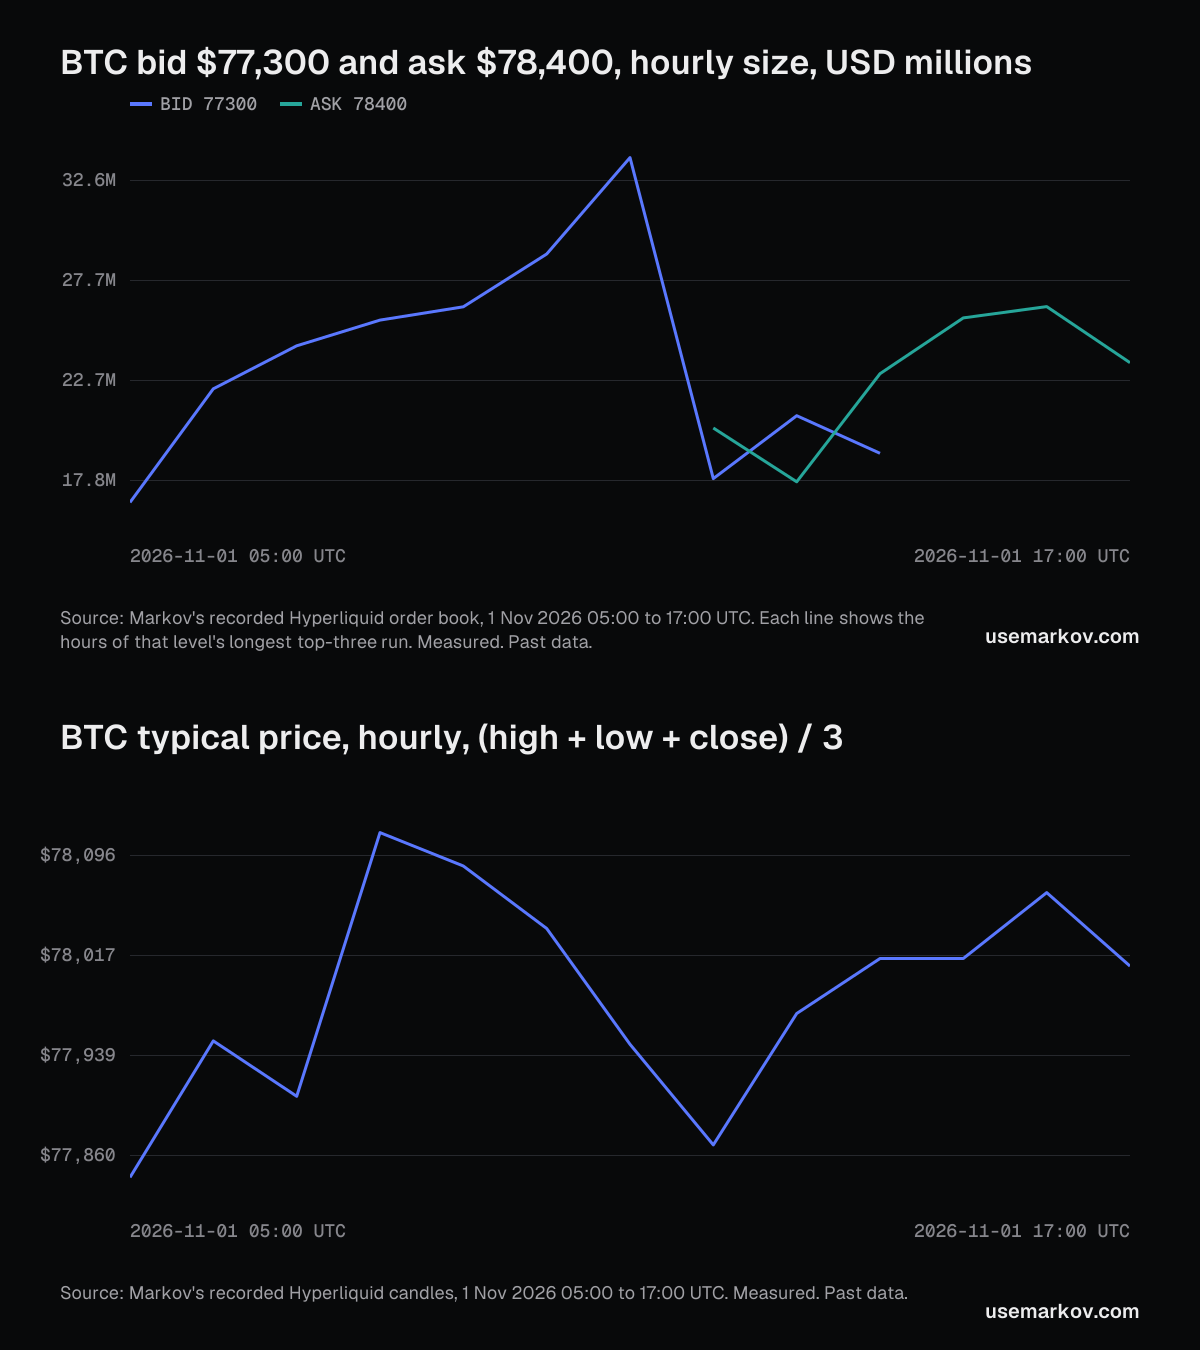
The chart follows the two longest runs of the week hour by hour. The $77,300 bid started in third place at $16.7M, was second at $22.3M in the next hour, and was first from 07:00 UTC ($24.4M) through 11:00 UTC, where its largest hour was $33.7M. It then held second place at $17.8M to $20.9M for the last three hours. The $78,400 ask ran between $17.7M and $26.4M.
What the record shows
- The longest a level kept a top-three place in this week was 10 hours, and no run reached 12.
- Most runs were short: 176 of 295 bid runs and 192 of 308 ask runs lasted one hour.
- About 78% of runs ended with the level still in view, so a short run is not evidence that the order left.
This is what the book looked like in hours that are over. It says nothing about whether price stopped at, passed through or moved away from any level, and a long run is not a promise that a level will hold.
How to read this
A week is a short sample. An hourly average cannot tell a level that stayed from one that was pulled and replaced inside the hour. The record covers only a band of about 3% around the price, and that edge is a limit of the record: a run that ends near it may only have moved out of view. The glossary explains the order book and resting liquidity, and the coin page shows the live market: BTC.
Where the numbers come from
Markov's own record of Hyperliquid BTC order books, 1h, UTC: the coarse book for the levels and each hour's candle for the typical price, (high + low + close) / 3. The window is 29 October 2026 00:00 UTC to 5 November 2026 00:00 UTC, end exclusive, with the longest-run comparison from 14 October 2026 20:00 UTC. The level step was $100 throughout. The run counts, averages and longest runs are recomputed from the hourly rows; how each run ended, the band width and the one-step shifts are as reported in the extract. Hyperliquid data only.
See it live
The Hyperliquid order book as the heatmap behind price is on the free plan for BTC, ETH and SOL, and the recorded history behind the run counts is on Pro. Open the chart to see it live, or look at the plans.
Markov provides research tools and education, not financial advice. Past data says what happened, not what will.