What funding is, and how Hyperliquid pays it
Funding is the payment between longs and shorts on a perpetual contract, which keeps its price close to the spot price. When the rate is positive, longs pay shorts. When it is negative, shorts pay longs.
Hyperliquid pays it every hour. The figures here are Hyperliquid's own hourly rate for each hour, as Markov recorded it. The 8-hour column is the hourly rate times 8, so it can be set beside venues that quote an 8-hour rate.
Hyperliquid's baseline rate is 0.00125% an hour, which is 0.01% per 8 hours. It shows up in the data below as 0.0013% an hour, once rounded to four decimals. It is the rate Hyperliquid shows when the premium is small, and it is not a cap: HYPE went above it, to 0.0215% an hour, while BTC, ETH and SOL did not in this window.
26 October to 1 November
Window: 26 October 2026 00:00 UTC to 2 November 2026 00:00 UTC, end exclusive. That is 168 hourly values per coin.
| Coin | Average, per hour | Highest, per hour | Lowest, per hour | Average, 8h equivalent |
|---|---|---|---|---|
| BTC | 0.0012% | 0.0013% (first of 154 hours at the baseline, 26 Oct 08:00) | -0.0013% (30 Oct 00:00) | 0.0095% |
| ETH | 0.0005% | 0.0013% (first of 80 hours at the baseline, 26 Oct 09:00) | -0.0077% (30 Oct 00:00) | 0.0043% |
| SOL | 0.0011% | 0.0013% (first of 130 hours at the baseline, 26 Oct 00:00) | -0.0011% (30 Oct 04:00) | 0.0086% |
| HYPE | 0.0025% | 0.0215% (30 Oct 01:00) | -0.0015% (26 Oct 02:00) | 0.0204% |
How the numbers are made: Hyperliquid's hourly rate is a fraction, so hourly % = fraction x 100. The 8-hour equivalent is hourly x 8, taken from the unrounded fraction, so it can differ in the last digit from the rounded hourly figure times 8. BTC as an example: 0.0000119236 x 100 = 0.0012%, and 0.0000119236 x 800 = 0.0095%. The average is the mean of the 168 hourly values.
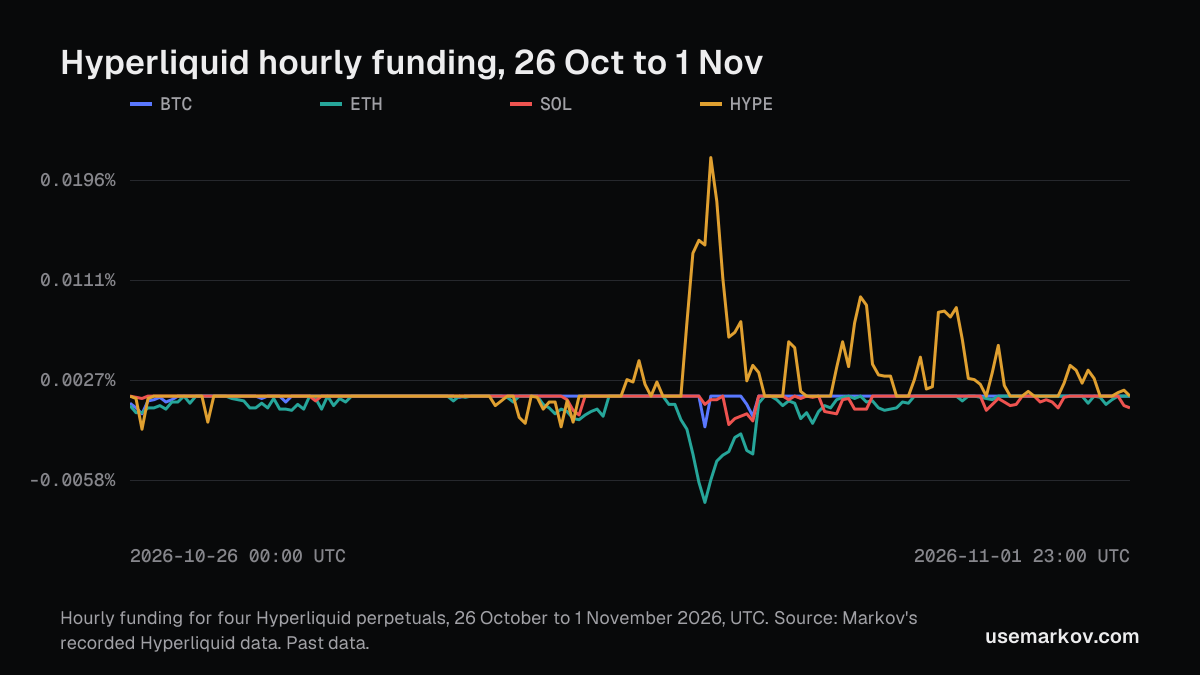
What the week shows
- For BTC, ETH and SOL the baseline rate (0.0013% an hour once rounded, 0.00125% before) was their highest hourly value of the week. They sat at it for 154, 80 and 130 of the 168 hours.
- Negative hours were rare for BTC (3 of 168), SOL (8) and HYPE (6). ETH had 23.
- The widest move in the week is HYPE on 30 October at 01:00 UTC: 0.0215% an hour, which is 0.172% per 8 hours and about 17 times the baseline rate (0.0215 / 0.00125 = 17.2).
- ETH's lowest hour, -0.0077% an hour (-0.0615% per 8 hours), came at 00:00 UTC on 30 October, the same hour as BTC's lowest.
Since 15 October
Markov's record of Hyperliquid begins on 2026-10-14T20:00Z, so the longest span of full days is 18 days, 15 October to 1 November (UTC). Of those 432 hours, 431 have a rate. One hour, 25 October 23:00 UTC, was not recorded and is not filled in.
| Coin | Average, per hour | Highest, per hour | Lowest, per hour | Average, 8h equivalent |
|---|---|---|---|---|
| BTC | 0.0011% | 0.0013% | -0.0013% | 0.0089% |
| ETH | 0.0007% | 0.0013% | -0.0077% | 0.0058% |
| SOL | 0.0008% | 0.0013% | -0.0035% | 0.0063% |
| HYPE | 0.0015% | 0.0215% | -0.0036% | 0.0124% |
Over the 18 days:
- HYPE's highest hour is the same 30 October hour as in the table above.
- SOL's lowest hour, -0.0035% an hour, was on 16 October at 19:00 UTC.
- HYPE's lowest hour, -0.0036% an hour, was on 24 October at 00:00 UTC.
The recorded history behind this 18-day table is a Pro view. The 26 October to 1 November table above uses the same record.
How to read this
Seven days is a short sample, and a funding rate says what traders paid in an hour that is over. It does not say what the next hour holds. The glossary explains the funding rate, and the coin pages read it live, for example BTC and SOL.
Where the numbers come from
Markov's own record of Hyperliquid funding, 1h bars, UTC. In the 7-day window there are no missing hours for any coin. In each coin, 36 of the 168 hours were recorded at between 81% and 99% of the hour (the rate is the last sample Markov took in that hour). Over the 18 days, 89 hours were partly recorded, the lowest at 68%. Measured, not modelled.
See it live
Funding for BTC, ETH and SOL is on the Derivatives tool (Free). HYPE is a Pro coin. The funding pane on the chart and the recorded history are on Pro. The figures in this post come from Markov's own Hyperliquid record, not from that page. Open the chart to see it live, or look at the plans.
Markov provides research tools and education, not financial advice. Past data says what happened, not what will.