What open interest means
Open interest is the amount of perpetual contracts that are open and have not been closed. It counts what is outstanding, not what traded. Volume is the count of what traded. A trade that opens a position raises open interest, and one that closes a position lowers it.
In crypto it is counted in the coin, for example BTC, or in US dollars. The dollar figure is the coin figure times a price, so it moves with price even when the coin figure does not. This post uses the coin figure and shows any dollar figure's multiplication.
What it does not say: whether longs or shorts are ahead, because in general every open position has a long and a short side. Where price goes next. And how many traders hold it, since one trader can hold a large share.
How Markov counts it
The figures here are Hyperliquid's own openInterest field, as Markov recorded it. Each hour's value is the last sample Markov took in that hour, sampled once a minute, so it sits about a minute or less from the hourly close. It is not an average.
One thing Markov measured. On Hyperliquid, the field appears to count both sides of a position: a new 1 BTC position, a long and a short, appeared to add 2 BTC, not 1. Markov found this by isolating single trades on thin Hyperliquid markets on 5 and 6 November 2026. In a first run on 12 coins, 24 of 26 moves were exactly twice the trade's size. In a second, independent run on 22 coins, of 76 trades 39 moved the figure by twice the size and 37 by zero, and none by one times. BTC and ETH trade too often for one trade to be isolated, so this was not measured on them. Hyperliquid's documentation does not state the basis. Read it as what Markov measured, not as a statement about Hyperliquid.
If it holds for BTC, a figure of 38,520 BTC would mean about 19,260 BTC held long and 19,260 BTC held short. Other venues may count one side only, so a figure here should not be set beside another venue's without allowing for that.
A worked example from the record: on 4 November 2026 at 23:00 UTC, Hyperliquid's BTC open interest was 38,520.0208 BTC and its mark price in that hour was $80,446. 38,520.0208 x 80,446 = $3,098,781,593, about $3.10 billion, which, if the both-sides reading above holds, counts both sides.
BTC and ETH since 14 October
Window: 14 October 2026 20:00 UTC to 5 November 2026 00:00 UTC, end exclusive. That is 508 hours; 507 have a value for each coin. The hour of 25 October 23:00 UTC has no record for either coin. It is missing, not zero, and a run of hours that crosses it counts as broken. In coin, last sample in the hour.
| BTC | ETH | |
|---|---|---|
| First (14 Oct 20:00 UTC) | 40,608.3965 | 1,087,510.938 |
| Last (4 Nov 23:00 UTC) | 38,520.0208 | 1,026,621.008 |
| Highest | 45,833.9527 (23 Oct 14:00 UTC) | 1,137,798.3064 (28 Oct 14:00 UTC) |
| Lowest | 38,487.9078 (4 Nov 22:00 UTC) | 960,376.514 (3 Nov 01:00 UTC) |
| Change first to last | -5.14% | -5.60% |
How the numbers are made: change = (last - first) / first x 100. BTC: (38,520.0208 - 40,608.3965) / 40,608.3965 x 100 = -5.14%. ETH: (1,026,621.008 - 1,087,510.938) / 1,087,510.938 x 100 = -5.60%.
The last 7 full days
Window: 29 October 2026 00:00 UTC to 5 November 2026 00:00 UTC, end exclusive. That is 168 hours per coin, all with a value.
| BTC | ETH | |
|---|---|---|
| First (29 Oct 00:00 UTC) | 43,666.6621 | 1,111,405.8412 |
| Last (4 Nov 23:00 UTC) | 38,520.0208 | 1,026,621.008 |
| Highest | 44,116.2464 (29 Oct 23:00 UTC) | 1,136,652.2058 (29 Oct 14:00 UTC) |
| Lowest | 38,487.9078 (4 Nov 22:00 UTC) | 960,376.514 (3 Nov 01:00 UTC) |
| Change first to last | -11.79% | -7.63% |
BTC: (38,520.0208 - 43,666.6621) / 43,666.6621 x 100 = -11.79%. ETH: (1,026,621.008 - 1,111,405.8412) / 1,111,405.8412 x 100 = -7.63%.
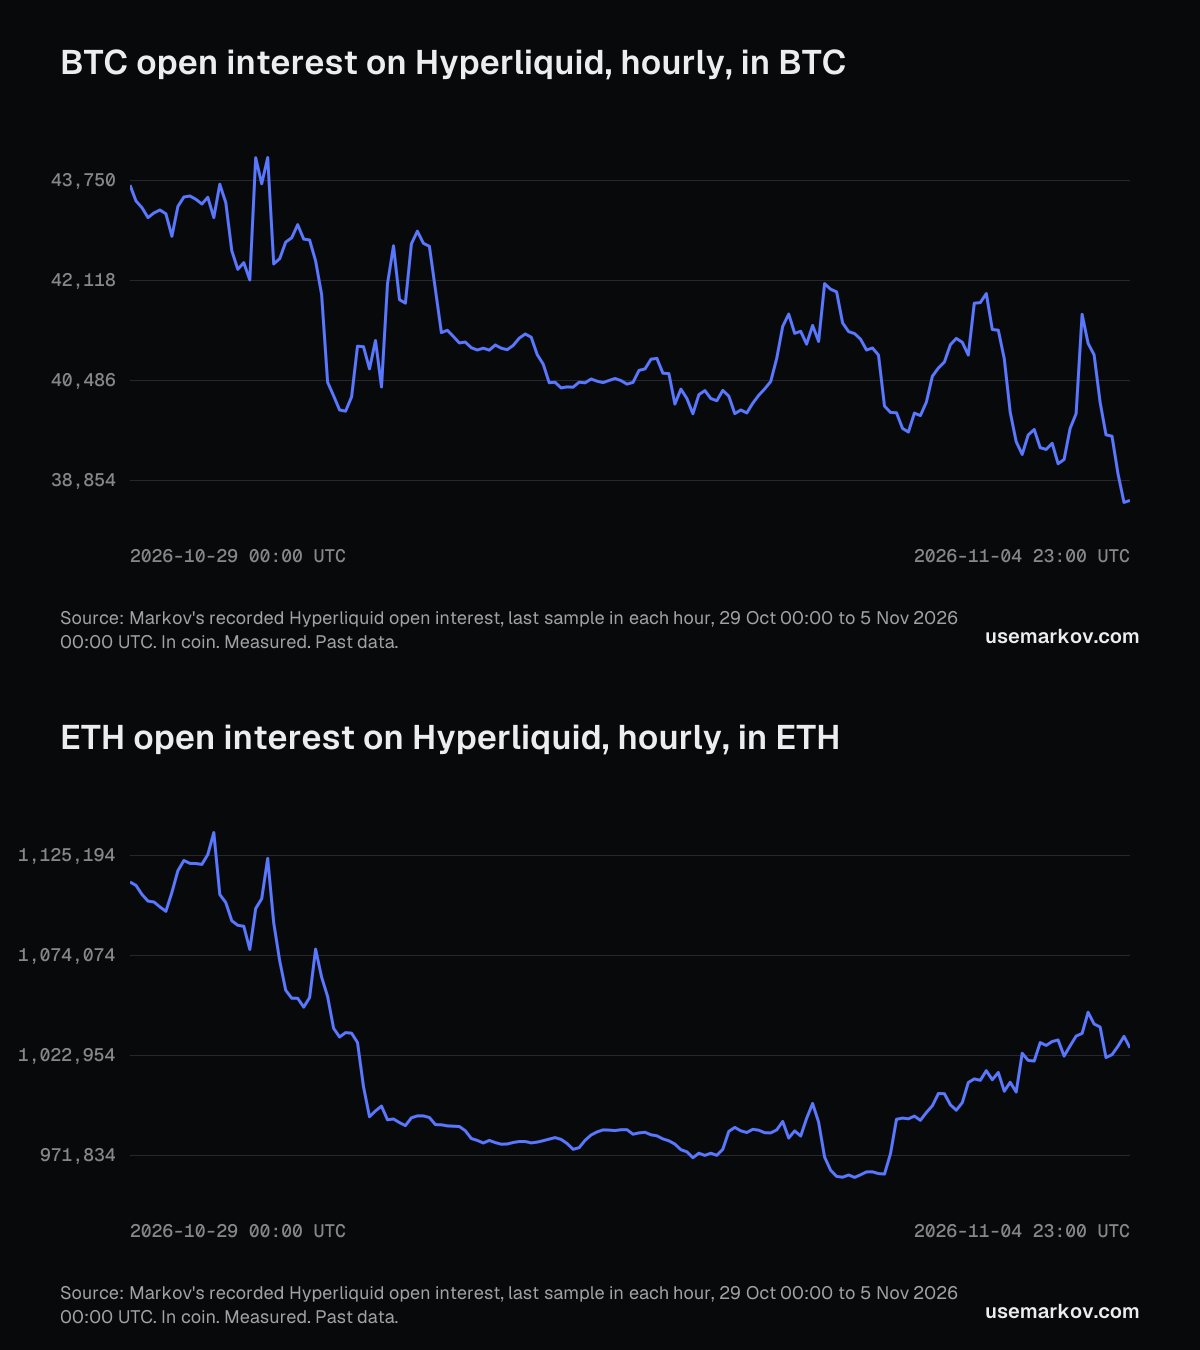
The chart shows the same seven days hour by hour, each coin on its own scale because ETH is counted in far larger numbers than BTC.
What the record shows
Largest one-hour changes between adjacent recorded hours, since 14 October:
| Coin | Rise | Fall |
|---|---|---|
| BTC | +1,992.794 BTC (+4.73%), 29 Oct 20:00 to 21:00 UTC, from 42,119.5881 to 44,112.3821 | -1,735.088 BTC (-3.93%), 29 Oct 23:00 to 30 Oct 00:00 UTC, from 44,116.2464 to 42,381.1584 |
| ETH | +30,875.7386 ETH (+2.95%), 18 Oct 15:00 to 16:00 UTC, from 1,047,939.8084 to 1,078,815.547 | -32,835.3652 ETH (-2.92%), 29 Oct 23:00 to 30 Oct 00:00 UTC, from 1,123,399.6746 to 1,090,564.3094 |
Each change is the new hour's value minus the previous hour's, and the percentage is that change over the previous value. BTC's rise: 44,112.3821 - 42,119.5881 = 1,992.794, and 1,992.794 / 42,119.5881 x 100 = 4.73%. The largest fall for both coins came in the same hour, the one starting 30 October 00:00 UTC.
This is how much was open in hours that are over. It says nothing about what price did, who was ahead, or why a figure moved.
How to read this
About three weeks is a short sample, and an hourly last value hides what happened inside the hour. Of the 507 hours per coin, 108 (21.3%) were only partly recorded, the lowest at 68%, though each value is still that hour's last sample. The glossary explains open interest, and the coin pages read it live: BTC and ETH.
Where the numbers come from
Markov's own record of Hyperliquid open interest, 1h, UTC, from 14 October 2026 20:00 UTC to 5 November 2026 00:00 UTC, end exclusive, and the last 7 full days from 29 October 2026 00:00 UTC. There are 508 hours in the range and 507 with a value per coin. 25 October 23:00 UTC has no record and is left out, not filled. Each value is the last sample in the hour, taken once a minute, in coin. The both-sides finding comes from Markov's own tests on thin Hyperliquid markets on 5 and 6 November 2026. Measured, not modeled. Hyperliquid data only.
See it live
BTC and ETH open interest are on the free chart, and the recorded history behind the tables is on Pro. Open the chart to see it live, or look at the plans.
Markov provides research tools and education, not financial advice. Past data says what happened, not what will.