What a BTC liquidation heatmap shows
A liquidation is a position closed by force because its margin fell below the exchange's maintenance requirement. A liquidation heatmap draws those closes on a grid. For example, price runs up the side and time runs across (some maps use price bands instead of time), and each cell gets a colour: the brighter the cell, the larger the total in it.
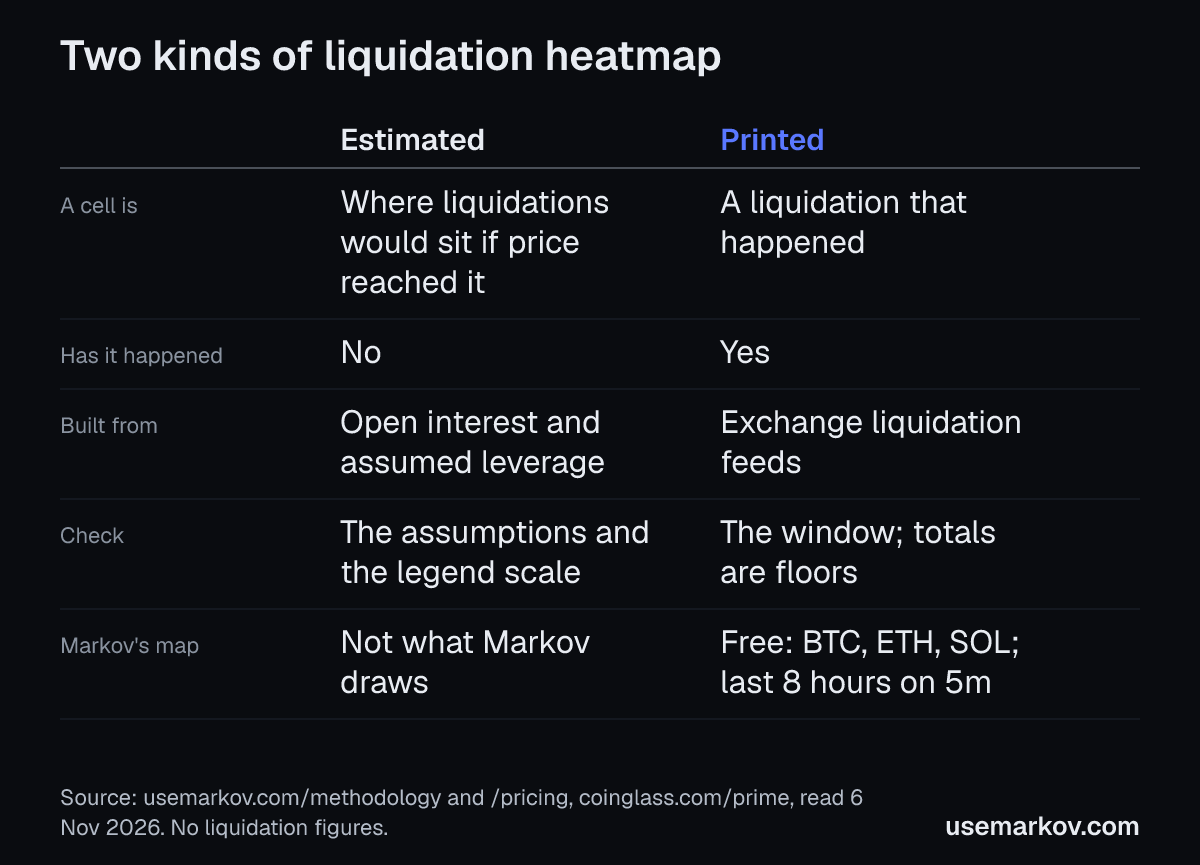
Maps usually fall into two kinds, and the first job is to know which one you are looking at.
- An estimate. The map works out where liquidations would sit if price reached each level, from assumptions about open positions and leverage. Nothing in it has happened. Maps of this kind are usually described as starting from open interest, the total of open positions. They assume how that total splits across leverage levels, then work out the price at which each slice would fall below its maintenance margin. CoinGlass's Prime FAQ puts it as built on market data and incorporating different leverage levels to estimate potential liquidation price zones (coinglass.com/prime).
- A record. The map draws liquidations that happened, where and when. Markov's methodology page says its liquidations are real prints, not a projection, and that Markov does not draw projected levels, "a guess about where leverage sits" (usemarkov.com/methodology).
How to read either kind
- Longs and shorts. Longs are forced out when price falls and shorts when it rises. Markov's chart marks longs below the bar and shorts above it.
- The scale belongs to the tool. A bright cell on one map is not comparable with a bright cell on another. Read the legend.
Four questions to ask of any map
- Estimated or printed? If the page does not say, ask the tool which it is.
- Whose data? A liquidation feed comes from a venue. A map built on one venue's feed does not show another venue's.
- What window? A map can cover hours or months. Compare like with like.
- Is the total complete? A feed can cap what it reports. Markov's methodology page says some of its feeds report at most one liquidation per symbol per second, so its totals are floors.
What Markov's map shows
- It draws realized forced liquidations by price and minute (usemarkov.com/pricing and /methodology, read 6 Nov 2026).
- It reads exchange feeds other than Hyperliquid's. Its liquidation feeds come from three third-party exchanges, listed on the methodology page.
- Stretches it did not record are drawn as "not recorded" and left out of every count. Nothing is interpolated.
On the Free plan, and what Pro adds
The Liquidations map is on the Free plan, which covers BTC, ETH and SOL with an account and no card. A free account sees the last 8 hours on 5m. Pro adds longer recorded history: paid plans see the record on 1h and 4h charts from the day Markov began recording, and the window grows to 30 days as it records (usemarkov.com/pricing).
See it live
The live chart shows the liquidations map for BTC with a free account. You can look at it next to whatever heatmap you use now. See also the glossary entry for liquidations, the BTC liquidations page and the plans for the longer recorded history.
Source: usemarkov.com/methodology, usemarkov.com/pricing and coinglass.com/prime, all read on 6 November 2026.
Markov provides research tools and education, not financial advice. Past data says what happened, not what will.