What a whale tracker shows here
A whale tracker lists large trades. This one counts what Markov recorded on Hyperliquid for BTC and ETH: large prints, with the side that took the trade. This post counts prints only. It uses no wallet and says nothing about who traded or why.
A print is the fills of one aggressive order folded into one trade, at its size-weighted price. Markov's collector folds fills that share a coin, transaction hash, side and taker wallet (a fill with no real hash folds by time, side and taker). The taker is the side that crossed the book: a print lifted offers when the taker took resting asks, and hit bids when it took resting bids.
Every print here is $100,000 or more. That is the threshold Markov's archive keeps for BTC and ETH, and it did not change in this range. A trade under $100k is not in these counts.
One week, 30 October to 5 November
The range is 30 October 2026 00:00 UTC to 6 November 2026 00:00 UTC, end exclusive: 168 hours, with a record for every hour on both coins.
| BTC | ETH | |
|---|---|---|
| Prints of $100k or more | 31,998 | 12,113 |
| Total value | $15,635,960,073 | $4,518,776,492 |
| Offers lifted, prints and value | 15,773 and $7,522,859,180 | 5,994 and $2,221,834,820 |
| Bids hit, prints and value | 16,225 and $8,113,100,893 | 6,119 and $2,296,941,672 |
| Offers lifted as a share of value | 48.1% | 49.2% |
| Average print | $488,654 | $373,052 |
| Prints of $1M or more | 2,863 (8.9%) | 838 (6.9%) |
| Largest print recorded | $28,806,964 | $22,433,757 |
Every count and total here is a floor, because 88 hours per coin were recorded for 96 to 99% of the hour. The average and shares are computed from floors.
How the derived rows are made: the offers-lifted share of value is offers-lifted value divided by total value, so BTC is 7,522,859,180 / 15,635,960,073 = 48.1% and ETH is 2,221,834,820 / 4,518,776,492 = 49.2%. The average print is total value divided by prints: 15,635,960,073 / 31,998 = $488,654 for BTC and 4,518,776,492 / 12,113 = $373,052 for ETH. The $1M shares are 2,863 / 31,998 = 8.9% and 838 / 12,113 = 6.9%.
Over the week, offers lifted and bids hit were close to even by value on both coins. That says nothing about which way anyone expected price to go: each print has a taker and a maker, and both sides of a trade are there.
Day by day
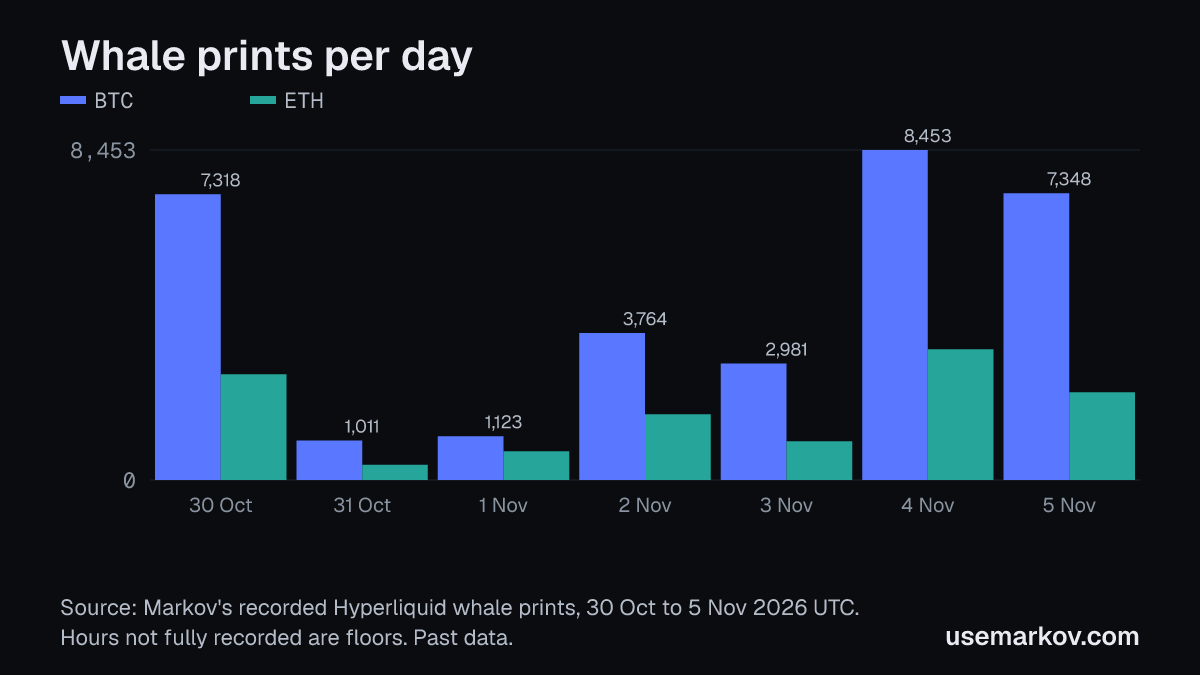
| UTC day | BTC prints | BTC value | ETH prints | ETH value |
|---|---|---|---|---|
| 30 Oct | 7,318 | $3.58B | 2,707 | $1,031M |
| 31 Oct | 1,011 | $0.45B | 393 | $131M |
| 1 Nov | 1,123 | $0.62B | 739 | $197M |
| 2 Nov | 3,764 | $1.73B | 1,686 | $646M |
| 3 Nov | 2,981 | $1.47B | 995 | $425M |
| 4 Nov | 8,453 | $4.30B | 3,346 | $1,219M |
| 5 Nov | 7,348 | $3.47B | 2,247 | $871M |
Every count and total in this table is a floor, because 88 hours per coin were recorded for 96 to 99% of the hour.
The busiest day for BTC was 4 November with 8,453 prints, and the quietest was 31 October with 1,011: 8,453 / 1,011 is about 8.4 times. For ETH the same two days were 3,346 and 393, about 8.5 times. The two coins moved together: both had their busiest day on 4 November and their quietest on 31 October. This record does not say why.
Hour by hour
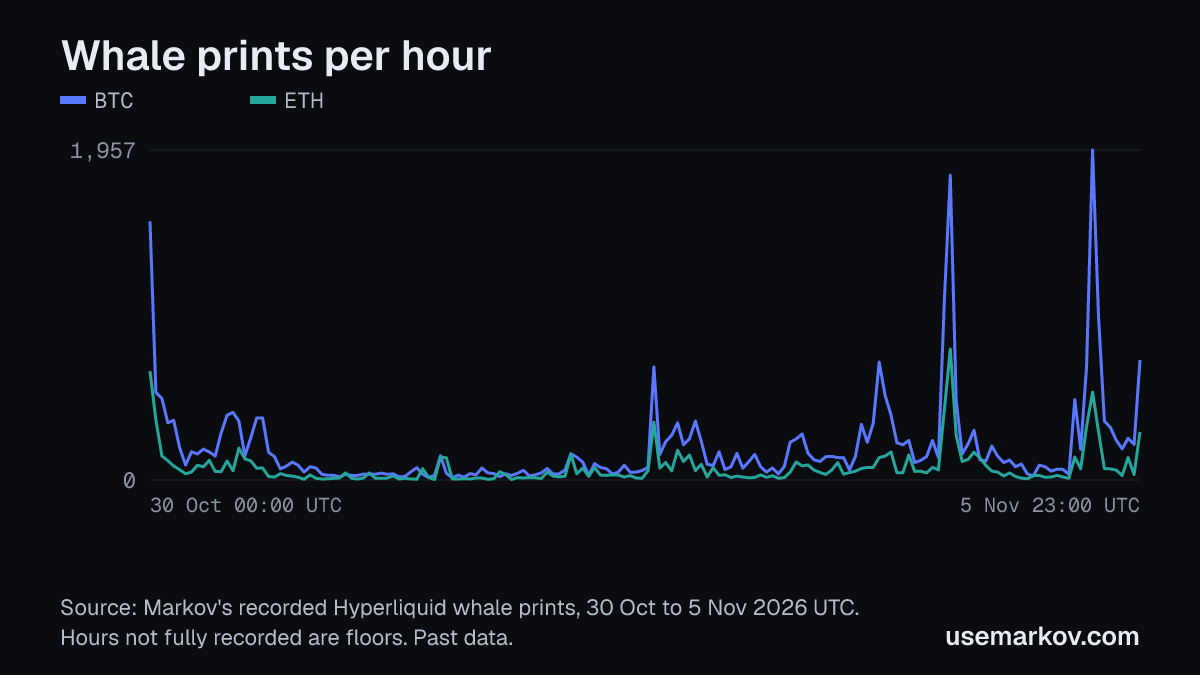
The median hour held 107 BTC prints and 42 ETH prints, and the quietest hours held 13 and 3. Activity came in bursts. BTC's three busiest hours were 15:00 UTC on 5 November (1,957 prints), 15:00 UTC on 4 November (1,807) and 00:00 UTC on 30 October (1,534). The five busiest BTC hours hold 7,340 of its 31,998 prints, 22.9%; for ETH the five busiest hold 2,716 of 12,113, 22.4%. BTC's three busiest hours are among the 88 partly recorded ones, so their counts are floors.
The five largest prints on each coin
BTC's five largest, all in this range:
| Time (UTC) | Taker | Price | Size, BTC | Value |
|---|---|---|---|---|
| 3 Nov 21:14:59 | hit bids | $77,827.5 | 370.1386 | $28,806,964 |
| 30 Oct 21:06:28 | hit bids | $76,754.6 | 341.3379 | $26,199,253 |
| 30 Oct 18:40:35 | lifted offers | $76,795.1 | 328.1429 | $25,199,766 |
| 1 Nov 01:24:16 | lifted offers | $77,702.7 | 311.6515 | $24,216,160 |
| 5 Nov 15:16:30 | lifted offers | $77,525.8 | 307.7045 | $23,855,040 |
Value is price times size, for example 370.1386 x 77,827.5 is about $28,806,962; the table shows the stored value, and size is rounded to 4 decimals. ETH's five largest:
| Time (UTC) | Taker | Price | Size, ETH | Value |
|---|---|---|---|---|
| 30 Oct 00:33:14 | hit bids | $2,207.59 | 10,162.103 | $22,433,757 |
| 4 Nov 16:24:13 | hit bids | $2,429.86 | 5,684.7329 | $13,813,105 |
| 30 Oct 01:31:25 | lifted offers | $2,183.08 | 5,554.9893 | $12,126,986 |
| 30 Oct 07:43:05 | hit bids | $2,235.34 | 5,000.0049 | $11,176,711 |
| 30 Oct 07:43:08 | hit bids | $2,233.73 | 4,999.9991 | $11,168,648 |
Six of ETH's ten largest prints are within 0.01 ETH of 5,000 ETH. This post says nothing about who traded or why, and a round size is only a round size.
What these counts can and cannot say
- They are prints of $100k or more. Trades under $100k are not counted, so this is not a count of all trades.
- They are floors in 88 hours. On each coin, 88 of the 168 hours were recorded for 96% to 99% of the hour. Prints in the unrecorded minutes are not here, so those hours' counts and values, and the week's totals, are floors. Nothing is estimated to fill them. No hour is missing.
- The stored prints match Markov's separately stored hourly totals. They were summed per hour and compared with those totals on all 336 coin-hours, in counts and value on both sides. That checks the stored data, not whether every trade on Hyperliquid was seen.
- Forced closes. Hyperliquid's public trades carry no forced-close flag, so Markov does not say whether any print was one. This post gives no liquidation figure.
- It is one venue and two coins. The record here is Hyperliquid BTC and ETH only. It is past data and says nothing about what comes next.
On the Free plan, and what Pro adds
Whale prints are drawn on the chart on the Free plan, which covers BTC, ETH and SOL with an account and no card. A free account sees the last 8 hours on 5m. Pro and Elite add the whale flow pane, and paid plans see the recorded history on 1h and 4h charts, a window that grows to 30 days as Markov records (usemarkov.com/pricing, read 6 Nov 2026).
See it live
The live chart draws Hyperliquid whale prints for BTC and ETH with a free account. You can look at it next to whatever tracker you use now. See also the BTC page, the glossary entry for whale prints and the plans for the recorded history.
Source: Markov's own record of Hyperliquid whale prints for BTC and ETH, 30 October 2026 00:00 UTC to 6 November 2026 00:00 UTC, end exclusive, by hour. Counts are of prints of $100k or more. Measured, not modeled.
Markov provides research tools and education, not financial advice. Past data says what happened, not what will.