What a SUI liquidation heatmap shows
A liquidation is a leveraged Sui position that an exchange closed because its margin ran out, and a liquidation heatmap draws those closes on a grid of price and time. Some maps estimate where closes could happen; Markov's draws the ones that printed, and does not draw projected levels on this page. The general reading is in our ETH liquidation heatmap post.
What is particular to SUI on Markov
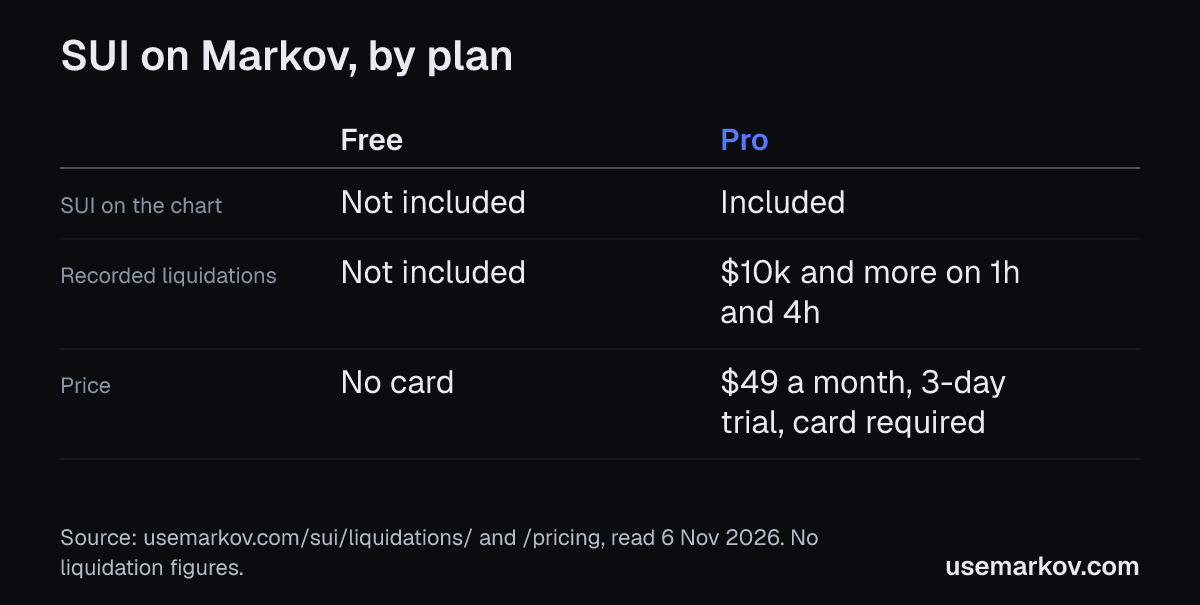
- SUI is a Pro coin. The free chart covers BTC, ETH and SOL. The SUI liquidations page opens with a free account, but SUI on the chart is part of Pro (usemarkov.com/sui/liquidations/, read 6 Nov 2026).
- Thinner books. Markov's SUI page describes Sui as a newer layer-1 with thinner books than the majors, so it sets its wall and whale thresholds lower. Separately, the 5m liquidation chart's label threshold is $62.5k for SUI, against $250k for BTC and ETH. These are label thresholds, not liquidation amounts.
- Where SUI's data comes from. The liquidations that printed come from three exchange feeds, longs and shorts in dollars. SUI funding, open interest and order book walls come from Hyperliquid (usemarkov.com/sui/, read 6 Nov 2026).
How to read the SUI view
- Longs are closed by force as price falls and shorts as price rises, so a burst can push price further the same way. The page calls this context for the next test of a level, not where SUI goes next.
- Totals are a floor: two of the three exchange feeds send at most one liquidation a second.
- A stretch the recorder missed is marked "not recorded" and never filled in.
- On the chart, a liquidity heatmap sits under the candles. It shows orders resting on the book, which are not liquidations.
On the Free plan, and what Pro adds
The SUI liquidations page opens with a free account and no card. Pro starts with a 3-day free trial (not in South Korea), card required, then $49 a month plus tax until you cancel. Paid plans also see recorded liquidations of $10k and more on the 1h and 4h charts, from the day Markov began recording (usemarkov.com/sui/liquidations/ and usemarkov.com/pricing, read 6 Nov 2026).
See it live
The live SUI liquidations page reads the feeds in your browser with a free account. The chart adds SUI with the liquidity heatmap on Pro. You can look at it beside whatever heatmap you use now. See also SUI funding, SUI open interest, SUI order book walls, the glossary entry for liquidations and the plans.
Source: usemarkov.com/sui/liquidations/, /sui/, /sol/liquidations/, /btc/liquidations/, /glossary/ and /pricing/, read on 6 November 2026.
Markov provides research tools and education, not financial advice. Past data says what happened, not what will.