Two kinds of liquidation heatmap
A liquidation is a position closed by force because its margin ran out. Two kinds of heatmap are searched under the same name.
- Modelled: an estimate of where liquidations would sit if price reached each level, worked out from assumptions about open positions and leverage. Nothing in it has happened yet.
- Realized: liquidations that actually happened, drawn where and when they occurred. Markov's liquidations map is this kind: its page describes them as real prints, not a projection.
How to read one
Both kinds share a layout: price up the side, time or price levels across, and a colour for each cell.
- Cell size: each cell covers one slice of price and, on a time chart, one slice of time. Small slices show fine detail, large slices smooth it out.
- Colour: usually dim to bright. Brighter means a larger total in that cell. On a modelled map that total is the amount estimated to close there. On a realized map it is the amount that was closed there.
- Scales differ: each tool sets its own scale, so a bright cell on one chart is not comparable with a bright cell on another. Read the legend.
- Longs and shorts: longs are forced out when price falls, shorts when it rises, so many tools show the two separately.
- Not a forecast: a modelled map is an estimate and a realized map is a record. Neither says where price goes next.
Hyperliquid ETH open interest and book, 26 October to 1 November
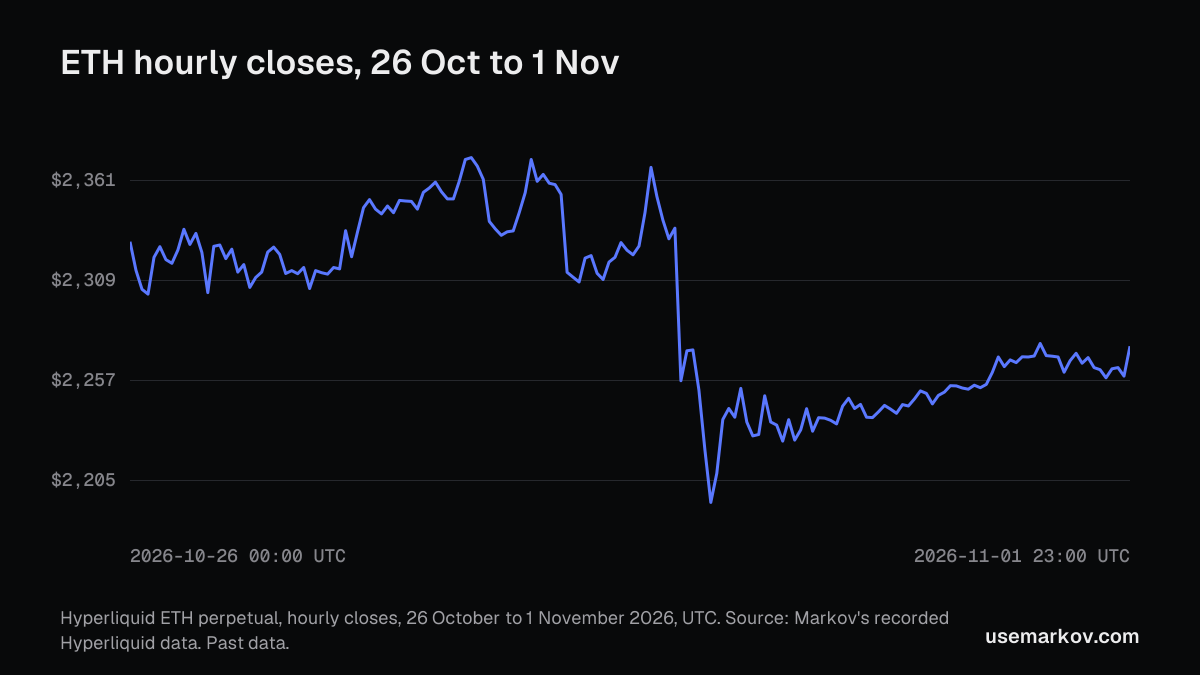
This section has no liquidation figures. Resting orders are not liquidations: a resting order is waiting in the book to be filled, while a liquidation is a forced close. Markov's chart draws Hyperliquid's order book as heat and puts open interest in its own pane. Here is what they recorded for ETH from 26 October 2026 00:00 UTC to 2 November 2026 00:00 UTC (end exclusive, 168 hourly bars).
| Measure | Value | How |
|---|---|---|
| Price, first open to last close | $2,328.80 to $2,274.60 | change = (2,274.60 - 2,328.80) / 2,328.80 = -2.3% |
| Intraday high and low | $2,391.00 (28 Oct 20:00 hour) and $2,173.10 (30 Oct 01:00 hour) | range = (2,391.00 - 2,173.10) / 2,328.80 = 9.4% of the first open |
| Open interest, start (26 Oct 00:00 hour) | 1,110,909 ETH, $2,583,529,002 | ETH x that hour's mark price of $2,325.60 |
| Open interest, end (1 Nov 23:00 hour) | 972,763 ETH, $2,213,201,970 | ETH x mark price of $2,275.17 |
| Open interest change | -138,145 ETH, -12.4% (-14.3% in USD) | from unrounded values: 972,763.34 - 1,110,908.58 = -138,145.24; / 1,110,908.58 = -12.4% |
| Open interest, highest and lowest hour | 1,131,560 ETH (28 Oct 19:00) and 970,456 ETH (1 Nov 22:00) | last sample in each hour |
| Funding, average (hourly, 8h equivalent) | 0.0005% and 0.0043% | 8h = hourly x 8, from the unrounded rate |
| Funding, lowest hour | -0.0077% an hour, -0.0615% per 8 hours (30 Oct 00:00) | the week's lowest price hour is 30 Oct 01:00 |
Funding is paid every hour on Hyperliquid. When it is negative, shorts pay longs. The 8-hour equivalent is the hourly rate times 8.
Open interest is the total size of open positions, here in ETH. The book shows where orders rest.
The order book in the last hour
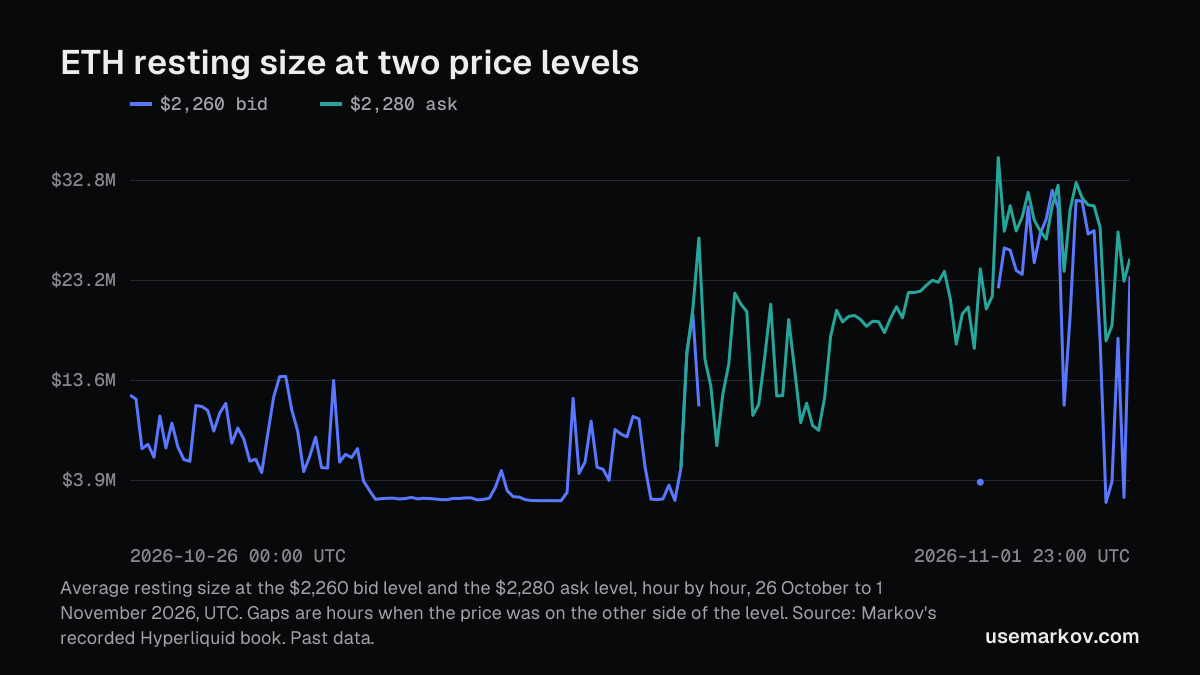
Markov stores each hour's average resting book, not instant snapshots, and the hour-by-hour figures below come from those stored hourly averages. A level appears in an hour only if it was among the 20 largest stored levels on its side that hour. These are the five largest levels on each side in the 1 November 2026 23:00 UTC hour: the average resting size over that hour, the 20 largest levels a side at $10 levels.
| Bids | Size, ETH | Size, USD | Asks | Size, ETH | Size, USD |
|---|---|---|---|---|---|
| $2,260 | 10,420 | $23,549,200 | $2,280 | 11,080 | $25,262,400 |
| $2,250 | 8,885 | $19,991,250 | $2,290 | 7,139 | $16,348,310 |
| $2,240 | 7,058 | $15,809,920 | $2,300 | 5,783 | $13,300,900 |
| $2,200 | 4,363 | $9,598,600 | $2,330 | 5,676 | $13,225,080 |
| $2,210 | 3,662 | $8,093,020 | $2,310 | 5,571 | $12,869,010 |
Size in USD is size in ETH times the level price, for example 10,420 x $2,260 = $23,549,200. The hour's last close was $2,274.60, between the largest bid and ask levels.
How much sat at these two levels in earlier hours? The chart below follows the $2,260 bid level and the $2,280 ask level every hour. A gap means the price spent that hour on the other side of the level, so no bid (or ask) rested there: in all 92 of the ask level's gap hours, and in 46 of the bid level's 48, the whole hour traded beyond it, and in the other 2 the price only touched $2,260. The bid level was in the stored top 20 in 120 of the 168 hours, with its largest hour at $31,820,800 (1 Nov 10:00) and its smallest at $1,777,942. The ask level was in the top 20 in 76 hours, all of them from 29 Oct 20:00 on, largest at $34,975,200 (1 Nov 01:00) and smallest at $5,111,760.
What Pro adds
Markov's Liquidations map is on the free plan. Pro adds the recorded history of liquidations on the 1h and 4h charts. This post prints none of those figures.
How to read this
One week is a small sample, and past data says nothing about the next move. The glossary explains liquidations and open interest, and the ETH liquidations page reads them live.
Where the numbers come from
Markov's own record of the Hyperliquid ETH perpetual: 1h candles, open interest, funding and the order book, 26 October to 1 November 2026, UTC. There are no missing hours in any of them. Thirty-six hours were recorded at between 81% and 99% of the hour. Open interest and funding are the last sample in each hour. Measured, not modelled.
See it live
The order book as heat and the open interest pane on the ETH chart are on the free plan. Open the chart to see it live, or look at the plans for the recorded liquidation history on Pro.
Markov provides research tools and education, not financial advice. Past data says what happened, not what will.