What an order book heatmap is
An order book is the list of orders waiting to be filled: bids below the current price and asks above it. An order book heatmap draws that list over time. Price runs up the side, time runs across, and each cell is coloured by how much size was resting at that price then. Brighter means more size.
Markov draws Hyperliquid's book as the heatmap behind price on the chart. That view is on the free plan.
Two things to keep in mind when reading one.
- Resting orders are not trades. Orders can be pulled before price gets to them, so a bright cell shows what was waiting, not what happened.
- Markov stores each hour's average resting book (every minute's book, averaged over the hour), not instant snapshots, and only the 20 largest levels on each side. They are the 20 with the most size, not the 20 nearest the price. A level outside those 20 is not in the data, which is not the same as zero.
BTC, ETH and SOL, 27 October to 2 November
Window: 27 October 2026 00:00 UTC to 3 November 2026 00:00 UTC, end exclusive. That is 168 hourly values per coin. "Above" means stored ask levels priced above the hour's typical price, "below" means stored bid levels priced below it. The typical price is the hour's (high + low + close) / 3. A level the price passed through during the hour, a bid above the typical price or an ask below it, is left out. Distance = (level price - typical price) / typical price x 100.
Rank is by size, largest first: rank 1 is the largest level on that side in an hour. The size is the average of that rank's size across the 168 hours, in USD (level price x size in coin), and the distance is the average of its distance from the typical price.
| Coin | Rank | Above: average size, distance | Below: average size, distance |
|---|---|---|---|
| BTC | 1 | $24,382,069, +0.75% | $24,778,810, -0.76% |
| BTC | 2 | $20,368,189, +0.68% | $20,593,790, -0.77% |
| BTC | 3 | $17,882,333, +0.60% | $18,122,515, -0.67% |
| ETH | 1 | $28,443,023, +0.57% | $28,373,454, -0.62% |
| ETH | 2 | $21,246,028, +0.87% | $21,411,019, -0.85% |
| ETH | 3 | $16,735,884, +1.32% | $16,282,345, -1.94% |
| SOL (mixed steps) | 1 | $9,606,087, +1.21% | $9,192,775, -1.15% |
| SOL (mixed steps) | 2 | $5,905,224, +1.04% | $5,715,289, -1.37% |
| SOL (mixed steps) | 3 | $3,507,474, +1.35% | $4,598,022, -2.04% |
The single largest level of the week, with the hour it was found in:
| Coin | Side | Level price | Average size in that hour | Distance from typical price | Hour (UTC) |
|---|---|---|---|---|---|
| BTC | Ask | $82,500 | $39,831,000 | +1.51% (typical price $81,270) | 28 Oct 23:00 |
| BTC | Bid | $77,800 | $46,376,580 | -1.46% (typical price $78,953) | 29 Oct 22:00 |
| ETH | Ask | $2,360 | $40,214,400 | +0.43% (typical price $2,349.87) | 27 Oct 23:00 |
| ETH | Bid | $2,340 | $40,341,600 | -0.44% (typical price $2,350.30) | 27 Oct 22:00 |
| SOL (mixed steps) | Ask | $103 | $25,997,200 | +0.80% (typical price $102.18) | 28 Oct 07:00 |
| SOL (mixed steps) | Bid | $100 | $25,480,000 | -0.91% (typical price $100.92) | 27 Oct 00:00 |
How the numbers are made: a level's size in USD is its price times its size in coin, so for the BTC ask level, $82,500 x 482.8 BTC is about $39.8M (the table uses the stored USD figure, $39,831,000). BTC's largest bid is 46,376,580 / 77,800 = 596.1 BTC. The distance is checked the same way: (82,500 - 81,270) / 81,270 x 100 = 1.51%.
A note on SOL
SOL's level step was mixed during the week. Markov stores the book in price levels, and the step follows the price. SOL's levels were $1 apart in 60 of the 168 hours and $0.10 apart in the other 108: mostly $1 early in the week and $0.10 from 29 Oct 19:00, with seven $0.10 hours before that (27 Oct 06:00, 08:00 and 09:00 among them). A wider step puts more price range into one level, so a SOL level stored at $1 holds a different slice of the book than one at $0.10. Level sizes from hours with different steps are not comparable, and this post does not compare them.
The SOL rows above, marked "mixed steps", average across both steps. Read them as not a size to compare, and not as a before-and-after, and do not read a change in SOL's level size within the week as a change in the book. SOL's two largest levels were both found in $1-step hours. BTC's step was $100 and ETH's was $10 in all 168 hours.
Large resting orders within 1% of the typical price
A heatmap shows where size rests. Another way to read the same book is to add up the stored levels within 1% of the hour's typical price, on each side. A level counts whole if its price is inside 1%. Only the 20 largest stored levels a side are in the sum, so a level that was not among the 20 largest that hour is not counted. The sums are large resting orders within 1%, a lower bound, not total depth.
| Coin | Average bid within 1% | Average ask within 1% | Bid minus ask | Difference as a share of ask |
|---|---|---|---|---|
| BTC | $108,330,925 | $106,830,013 | $1,500,912 | 1.40% |
| ETH | $50,741,920 | $50,201,601 | $540,319 | 1.08% |
| SOL (mixed steps) | $15,607,290 | $16,205,492 | -$598,202 | -3.69% |
How the numbers are made: each average is the mean of the 168 hourly sums, recomputed from the hourly rows in the extract. For BTC, the bid hours add to 18,199,595,406 and 18,199,595,406 / 168 = 108,330,925; the ask hours add to 17,947,442,182 and 17,947,442,182 / 168 = 106,830,013.
The difference is bid minus ask. For BTC, 108,330,925 - 106,830,013 = 1,500,912, and 1,500,912 / 106,830,013 x 100 = 1.40%. For ETH, 50,741,920 - 50,201,601 = 540,319, and 540,319 / 50,201,601 x 100 = 1.08%. For SOL, 15,607,290 - 16,205,492 = -598,202, and -598,202 / 16,205,492 x 100 = -3.69%.
SOL's sums are built from levels of two different steps, so read them as approximate.
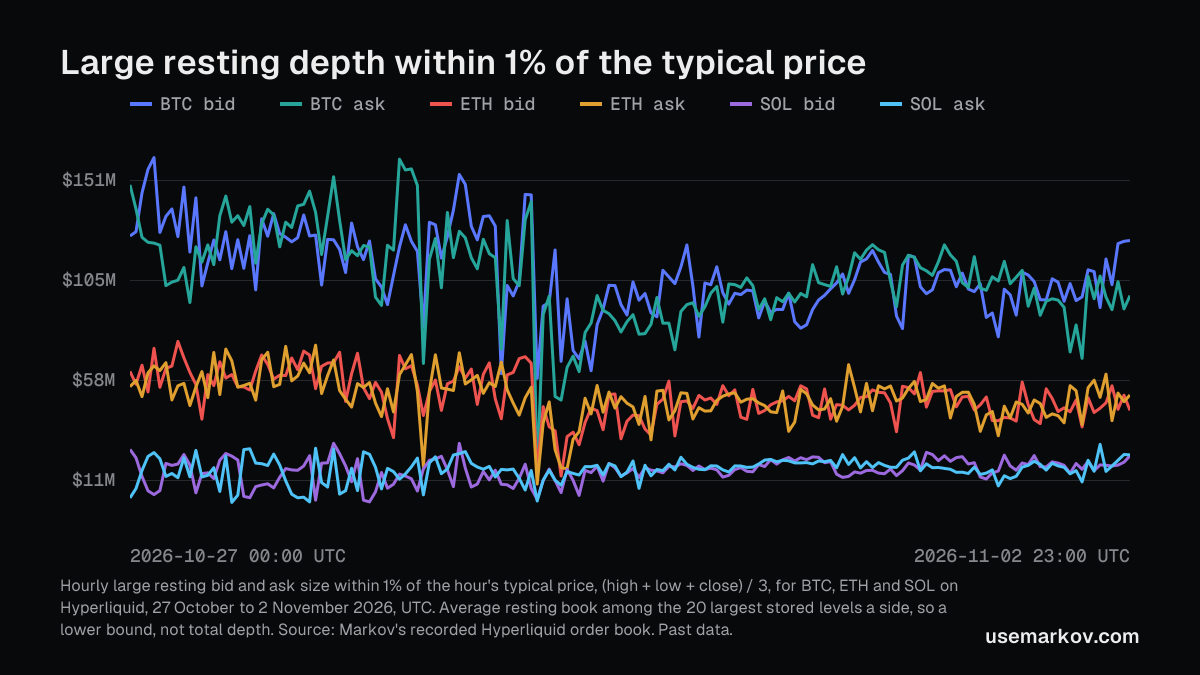
The chart follows the same sums hour by hour. The highest hours in the record are BTC's bid at $161,849,400 (27 Oct 04:00 UTC) and its ask at $161,079,451 (28 Oct 21:00 UTC). ETH's highest bid hour was $75,980,730 (27 Oct 08:00 UTC) and its highest ask hour $74,196,560 (28 Oct 07:00 UTC). SOL's highest bid hour was $28,365,100 (28 Oct 10:00 UTC) and its highest ask hour $27,827,243 (2 Nov 18:00 UTC).
What the week shows
- BTC's large resting orders within 1% of the typical price were about 2.1 times ETH's and about 6.9 times SOL's by bid size (108,330,925 / 50,741,920 = 2.1, 108,330,925 / 15,607,290 = 6.9). On the ask side the ratios were 2.1 and 6.6 (106,830,013 / 50,201,601 = 2.1, 106,830,013 / 16,205,492 = 6.6). The SOL ratios mix the two level steps.
- For BTC the single largest level was a bid, $77,800, at $46.4M, found in the 29 October 22:00 UTC hour when the typical price was $78,953. The largest ask level was $82,500 at $39.8M, found in the 28 October 23:00 UTC hour, 23 hours earlier.
- In their two hours, ETH's largest levels sat close to the typical price in both directions: $40.3M on the bid at -0.44% and $40.2M on the ask at +0.43%.
- Averaged by rank, ETH's top level on each side was $28.4M. The third-ranked levels sat further out, +1.32% above and -1.94% below.
This is what rested in the book, hour by hour, in a week that is over. It says nothing about whether price stopped at, passed through or moved away from any of these levels.
How to read this
Seven days is a short sample, and an average hides how the book changed from one hour to the next. Because 37 hours per coin were only partly recorded and only the 20 largest levels a side are stored, the averages are lower bounds that could move with more levels or complete hours. The glossary explains the order book and resting liquidity, and the coin pages show the live market: BTC, ETH and SOL.
Where the numbers come from
Markov's own record of Hyperliquid perpetual order books, 1h, UTC: the coarse book for the levels and each hour's candle for the typical price, (high + low + close) / 3. The window is 27 October 2026 00:00 UTC to 3 November 2026 00:00 UTC, end exclusive. There are no missing book hours for any coin and none are left out: 168 of 168 hours each. In each coin, 37 of the 168 hours were recorded at between 95% and 99% of the hour. Each stored row is the hour's average resting book, cut to the 20 largest levels on each side, not the 20 nearest the price. A level outside those 20 is not in the data, which is not the same as zero, so every figure within 1% is a lower bound. SOL's level step was $1 in 60 hours and $0.10 in 108, so SOL level sizes are not compared across the change. The averages and highest hours are recomputed from the hourly rows, not copied from a summary. Hyperliquid data only.
See it live
The Hyperliquid order book as the heatmap behind price is on the free plan, for BTC, ETH and SOL. Open the chart to see it live, or look at the plans if you want to know what else is there.
Markov provides research tools and education, not financial advice. Past data says what happened, not what will.