What a negative funding rate means
A perpetual contract has no expiry, so something has to keep its price near the price of the asset. That something is funding, a payment between the two sides of the contract. When the rate is positive, longs pay shorts. When it is negative, shorts pay longs. The sign says which side paid in that period. It does not say where price goes next, and this post makes no claim in either direction.
Hyperliquid pays funding every hour. The figures here are Hyperliquid's hourly rate for each hour, as Markov recorded it. The 8-hour figure is the hourly rate times 8, so it can be set beside venues that quote an 8-hour rate.
Per Hyperliquid's funding documentation, the rate has a fixed interest part, 0.01% per 8 hours (0.00125% an hour), plus a part that follows the premium of the contract over its oracle price. In SOL's record the median hour sits right at that fixed part, 0.00125% an hour. A negative hour is one where the premium part was negative enough to pull the whole rate below zero.
A worked example from the record: on 18 October 2026 at 14:00 UTC, SOL's rate was -0.0000189769 as a fraction an hour. Times 100, that is -0.0019% an hour. Times 8, from the unrounded rate, it is -0.0152% per 8 hours. For a position worth $10,000, one hour at that rate is $10,000 x 0.0000189769 = about $0.19. A short position received that, and a long position paid it.
How often SOL and HYPE were below zero
Window: 14 October 2026 20:00 UTC to 5 November 2026 00:00 UTC, end exclusive. That is 508 hours. One hour, 25 October 23:00 UTC, has no record for either coin, so each coin has 507 hours with a rate. That hour is missing, not zero, and a run of negative hours that crosses it counts as broken. "Below zero" means strictly below zero on the unrounded rate. No hour was exactly zero.
| Coin | Hours with a rate | Hours below zero | Share | Lowest hour | Longest run below zero |
|---|---|---|---|---|---|
| SOL | 507 | 62 | 12.2% | -0.0035% an hour (-0.0280% per 8 hours), 16 Oct 19:00 UTC | 10 hours, 18 Oct 11:00 to 20:00 UTC |
| HYPE (Pro coin) | 507 | 36 | 7.1% | -0.0036% an hour (-0.0284% per 8 hours), 24 Oct 00:00 UTC | 6 hours, 21 Oct 22:00 to 22 Oct 03:00 UTC |
How the numbers are made: share = hours below zero / hours with a rate x 100. SOL: 62 / 507 x 100 = 12.2%. HYPE: 36 / 507 x 100 = 7.1%. The per-day counts in the chart add up to the same totals.
Over the negative hours only, the average rate was -0.0007% an hour (-0.0053% per 8 hours) for SOL and -0.0010% an hour (-0.0079% per 8 hours) for HYPE.
A note on the SOL count. It uses Markov's recorded rate, the last sample in each hour. That is an estimate until the hour closes, so Markov also checked it against Hyperliquid's settled rates. Settled rates give 64 SOL hours below zero, not 62, because two near-zero SOL hours (15 October 14:00 and 30 October 20:00 UTC) fall on opposite sides of zero: both round to 0.0000%, recorded as slightly positive and settled as slightly negative. HYPE agrees, 36 on both. On the other 505 SOL hours the two agree on the sign, and the median absolute difference was 0.
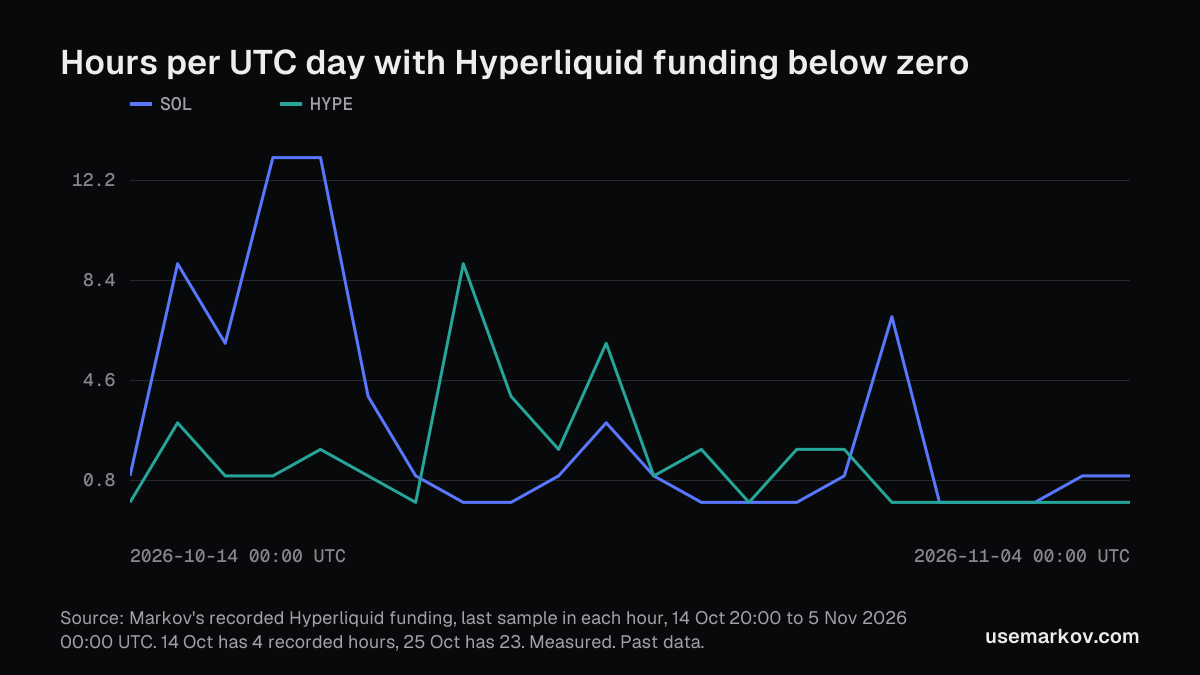
The chart counts negative hours by UTC day. The first day, 14 October, has 4 recorded hours only. SOL's highest days were 17 and 18 October, 13 hours each. HYPE's highest was 21 October, 9 hours.
The last 7 full days
Window: 29 October 2026 00:00 UTC to 5 November 2026 00:00 UTC, end exclusive. That is 168 hours per coin, all with a rate.
| Coin | Hours below zero | Share | Lowest hour |
|---|---|---|---|
| SOL | 10 | 6.0% | -0.0011% an hour (-0.0086% per 8 hours), 30 Oct 04:00 UTC |
| HYPE | 2 | 1.2% | -0.0013% an hour (-0.0107% per 8 hours), 29 Oct 00:00 UTC |
SOL: 10 / 168 x 100 = 6.0%. HYPE: 2 / 168 x 100 = 1.2%.
What the record shows
- SOL was below zero more often than HYPE over the whole record, 62 hours against 36, and in the last 7 days, 10 against 2.
- Both coins had a longer run in the first half of the window. SOL's longest run was 10 hours (18 October), HYPE's was 6 (21 to 22 October). In the last 7 days SOL's longest run was 5 hours (30 October 04:00 to 08:00 UTC) and HYPE's was 1.
- The lowest hours were small in size: about -0.0035% an hour for SOL and -0.0036% for HYPE.
This is the recorded rate in hours that are over. It says nothing about what price did before or after any of them.
How to read this
About three weeks is a short sample, and a count of hours hides how the rate moved inside each one. Of the hours counted, 108 per coin were only partly recorded (the lowest at 68%), though the rate is still that hour's last sample and stayed within about 0.0003% of the settled rate. The glossary explains the funding rate, and the coin pages read it live: SOL and HYPE.
Where the numbers come from
Markov's own record of Hyperliquid funding, 1h, UTC, from 14 October 2026 20:00 UTC to 5 November 2026 00:00 UTC, end exclusive. There are 508 hours in the range and 507 with a rate per coin. 25 October 23:00 UTC has no record and is left out, not filled. The rate is the last sample Markov took in each hour. The settled-rate comparison uses Hyperliquid's public funding history as a check only. Measured, not modeled. Hyperliquid data only.
See it live
Funding for SOL is on the Derivatives tool (Free). HYPE is a Pro coin, and the recorded history behind the counts is on Pro. Open the chart to see it live, or look at the plans.
Markov provides research tools and education, not financial advice. Past data says what happened, not what will.